Over the years I’ve messed with various home automation systems. From X10 in the early 2000’s, through Mi Casa Verde and z-wave going into the 2010’s, a few years using OpenHAB, up to the current day where I’m using Home Assistant.
Home Assistant has been around for a while, but I was loathe to move from OpenHAB as I already had a lot set up. However, as OpenHAB fell behind I finally bit the bullet and installed HAOS on a spare Raspberry Pi. This turned out to be a good thing.
I’ve been using it now for a couple of years, and it works really well as a central hub for all the different technologies in the house. This post is a quick overview of what I have set up.
Technologies
The beauty of Home Assistant is that it acts as a hub for many different home automation protocols, devices, and other information. A quick list of technologies I have integrated:
- Zigbee
- Z-wave
- ESPHome
- Matter
- Thread
- MQTT
- WLED
But not only does it talk to these home automation systems, it can also tie into other things such as:
- 3d Printers (Octoprint, Klipper, Bambu Labs)
- Google Assistant (Ties your home automation into google voice commands)
- Jellyfin/Plex
- Fitbit
- Raspberry Pi
- Roomba
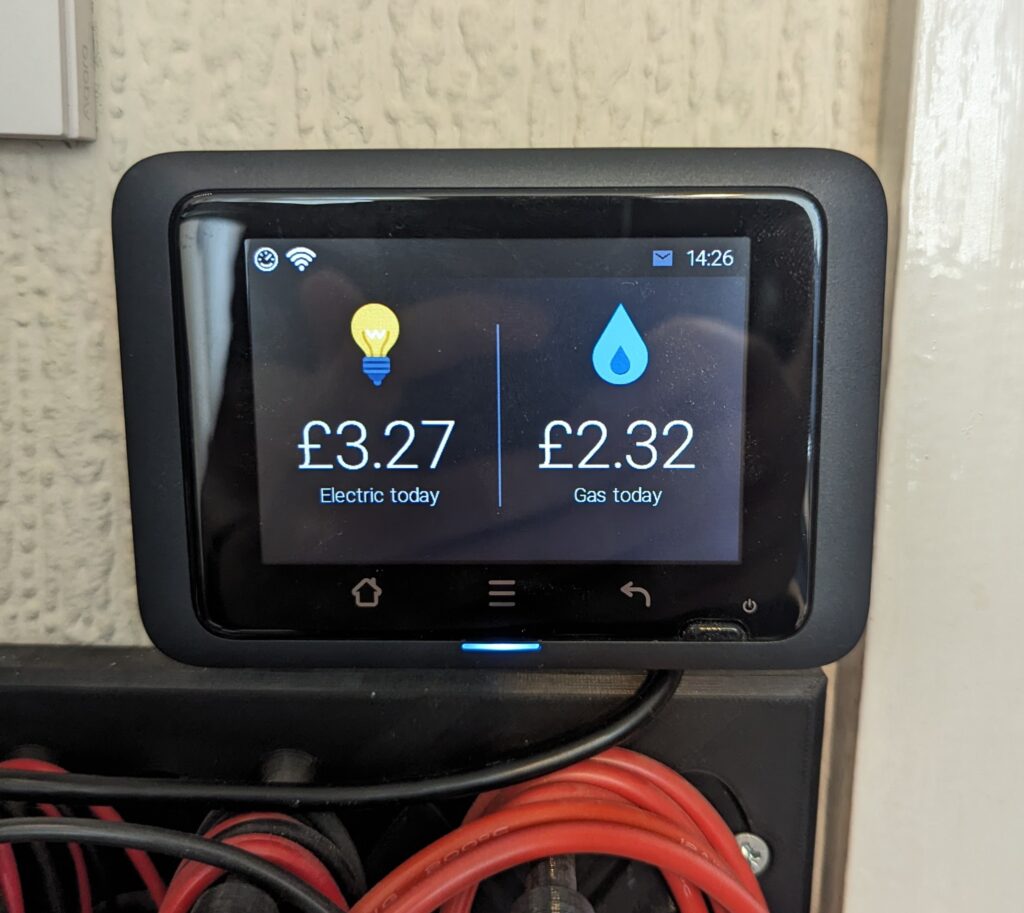
- Smart Meters
- Printers (you know, the none 3d kind)
- Frigate (CCTV)
- Solar Production
And lastly, you can pull in information from web APIs to help with automations:
- Weather
- Sunrise/Sunset
- Moon phases
- Astronomy Weather (More detailed weather more geared to astronomers)
- Github (Monitor commits, issues, etc.)
- Whois (Keep an eye on domains expiring)
- DVLA (MOT and insurance due dates)
- Waste Management (get dates and types of refuse collection)
This is a lot of tech, and this isn’t a complete list of everything I have tied in, just the majority.
My Setup
So, enough of what it can talk to. How is my house set up?
Core
The main core of the system is a Raspberry Pi 4 running Home Assistant OS. This is a simple install onto a Pi and is fully managed by Home Assistant. Everything runs in containers and gives you everything you need to get started.
The Pi is run from PoE in a rack, to keep things simple, and also has everything installed onto an SSD drive as it is a lot more reliable that using an SD Card (My old OpenHAB system was on SD Card and I had to rebuild it every now and again as the SD card wore out). Plugged into the Pi are two USB dongles, one for z-wave and one for Zigbee/Matter. This direct connection lets me control the majority of the devices I have.
Also, installed as part of HA OS I have a few other addons. These are:
- InfluxDB – This keeps a historical record of all the stats in the house, which can then be pulled out into a Grafana Dashboard
- Mosquitto MQTT Broker – Some devices talk directly to an MQTT server, so this is running to fill that role
- ESPHome – A system designed to convert simple ESP32 or ESP8266 boards into home automation devices using a simple yaml language. Some commercial devices can also be flashed with ESPHome for extra functionality.
- HA Google Backup – Backups!!
- Lets Encrypt – Automatically renews my SSL cert
- VaultWarden – A locally run version of Bitwarden password manager.
These are all running on the same Pi quite happily.
CCTV (Frigate)
I have a second Pi 4 running a system called Frigate. This is an open source CCTV system that integrates really nicely with Home Assistant. It also has functionality for not only motion detection but facial detection too so that it will only trigger if it detects a human (not a cat or squirrel) which definitely helps cut down on false positives. I have had to block out certain areas for detection tho, as in high winds it sometimes thought some of Joy’s flowers were a human!
I’m hoping to upgrade this to a Pi 5 when the PoE hat comes out, as I currently have 4 cameras going into it and it does struggle a bit. I do have a USB Coral AI stick from Google that I can offload some of the more AI related tasks too.
NAS (TrueNAS Scale)
I do have a NAS box set up that has a simplified Kubernetes system installed. On this I run a few other services, including Grafana for viewing stats of my home, Spoolman which keeps track of my 3d printer filament usage, and Trilium Notes for keeping track of the random things in my brain.
Other Hardware
So what have I actually got set up?
Most of the main lighting in the house are Phillips Hue lights, with their dimmer controllers. However, since realising just how much data the Hue hub was sending back, I removed that and now everything is directly controller via Zigbee. The only main exception to this is the garage which initially had fluorescent tubes and I use a z-wave in wall module to control that.
I’ve a lot of smart sockets around the house too, from plugin units to actual in wall faceplates. The vast majority of these allow for energy usage collection too so I can not only turn things on and off remotely, but I can also monitor the energy usage of various items such as 3d printers, server cabinets, desktops, TVs, etc.
The burglar alarm is also connected in, which turns all the various door and motion sensors into sensors that Home Assistant can use for automations.
WLED is a system to install onto an ESP8266 or ESP32 to control a string of RGB LEDs. I’m starting to incorporate more of these into the setup and they tie very nicely into Home Assistant
Control
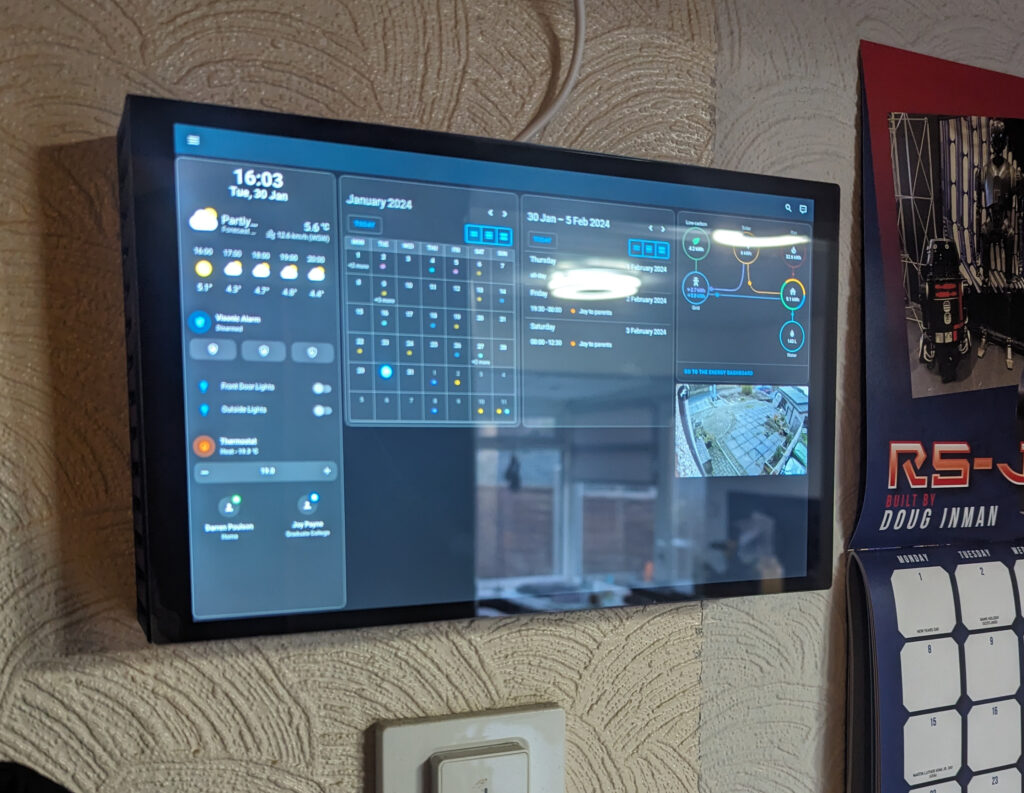
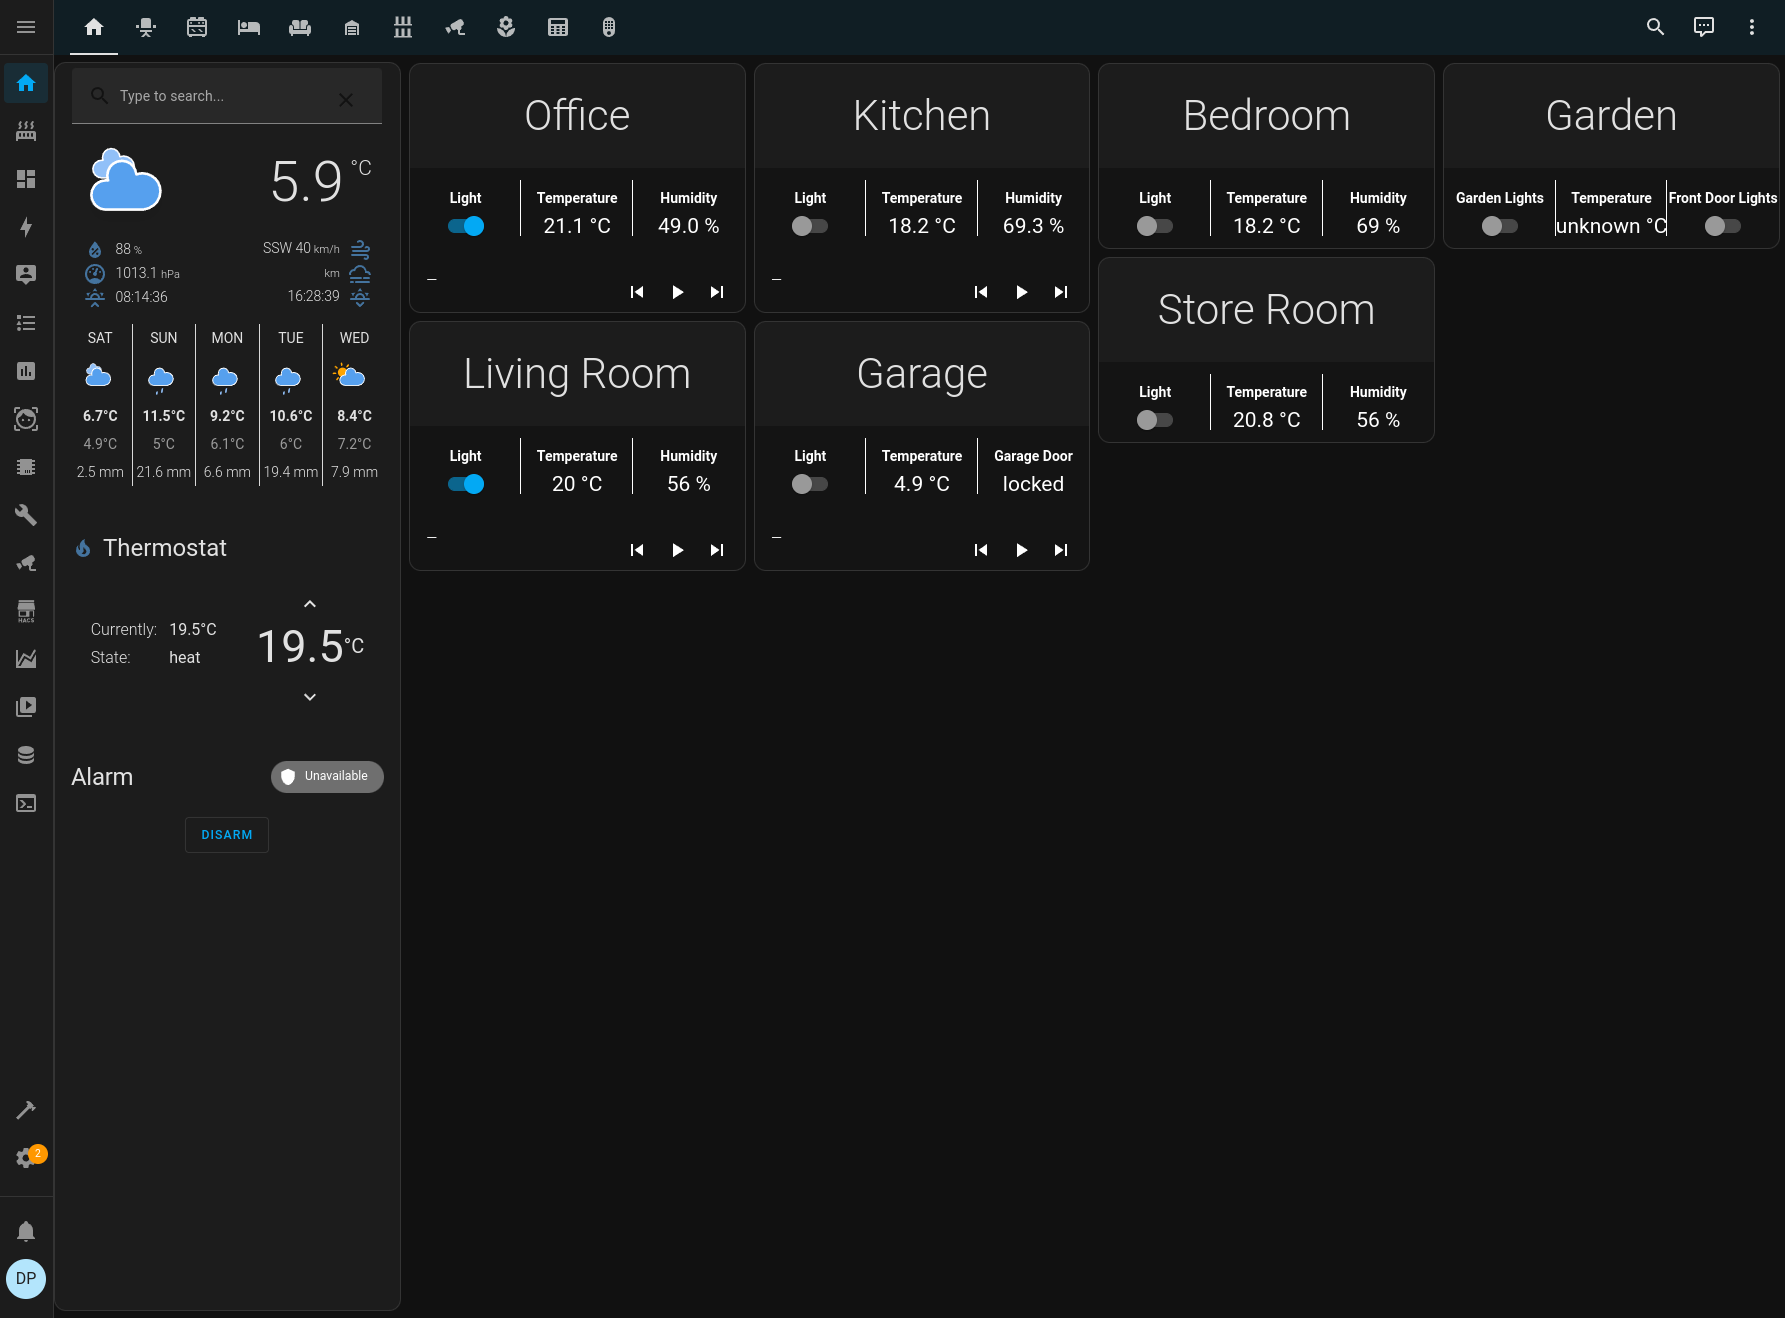
What does all this gain me? The main benefit is a single app on my phone to control everything. I don’t need a Hue app, a Roomba app, to access a webpage to control my WLED lights, etc. I can create a dashboard on Home Assistant to give me a nice overview of the controls in the house. For instance, my setup main dashboard consists of an overview page (simple controls such as lights, along with main thermostat control and some other status) with the ability to click a room and get more detailed controls and information. That covers about 90% of everything.
Along with this, as I have Google Assistant integrated, I can also just ask google to turn lights on, set the thermostat, etc.
Automations
So far, most of the stuff is just allowing for remote control, but the real beauty is making things automatic. I’ve only really got some basic automations done at the moment and want to expand on this in the future.
- Automatic outside lights. I have the lights set to come on at sunset, and turn off at midnight. They’ll also come on in the morning if Joy is going to work and its still dark out.
- Turn the thermostat down at night. The thermostat will drop a couple of degrees at midnight whilst we’re asleep to save some energy. I have got the alternative set to turn it back up in the morning, but thats disabled for now as its just as easy to turn it up manually depending on what time we get up.
- Send an alert if someone comes to the front door, and turn the light on. This is one of the reasons I want to upgrade the Frigate Pi. The Pi 4 is just a little slow on this, and hoping the extra processing power will speed things up.
- Show video feed on my google home displays when someone is detected on the front door camera.
- Automatic office lights. I’m terrible at remembering to turn my light off in the office, so I have a simple motion detector to automatically turn the lights on and off. They do turn off occasionally if I’m in the office concentrating on something and not moving much (such as writing a blog post about my home automation system) so I’ve just ordered some mm wave detectors to try which should be more sensitive.
- Notifications when prints have finished or theres an issue.
- Daily notification if a battery is low in a device. All my Phillips Hue Dimmers were bought at the same time, and I’ve just had to replace all the batteries at once!
Theres room to do a lot more of course, but these will do for now.
Monitoring
So, I’m a nerd and I like stats. One of my favourite things that Home Assistant does is store historical data so that I can pull information out and graph it in Grafana. I’ve no idea if this will have future uses, but it does produce some pretty pictures such as the one on the left that shows temperature and humidity over time.
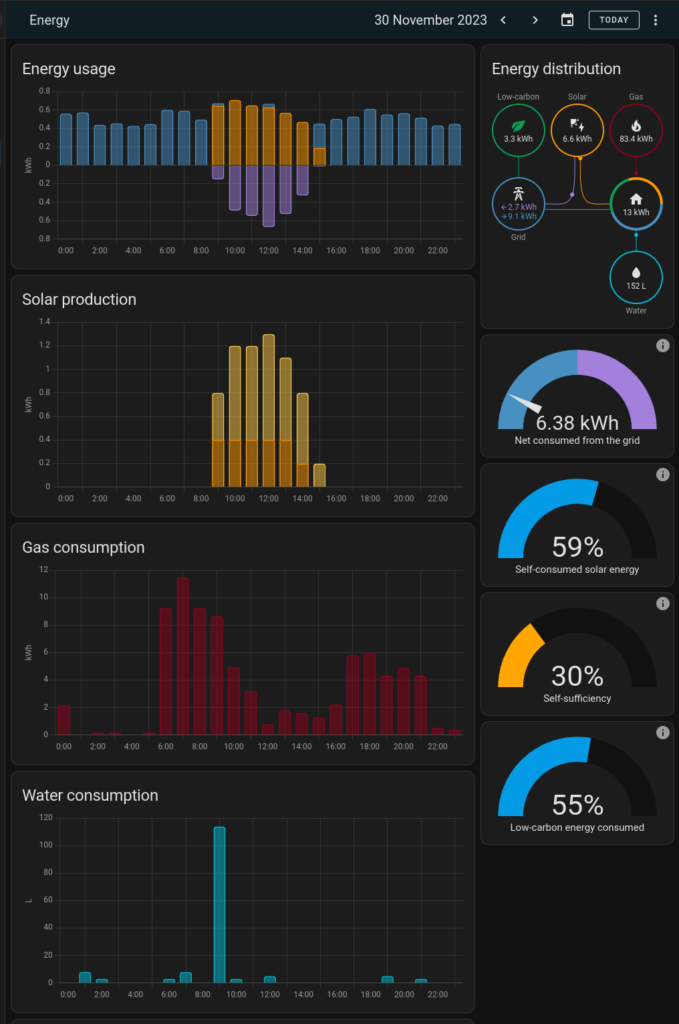
Also, Home Assistant has an inbuilt energy dashboard. You can select the various entities you monitor for energy usage from smart meters or solar panels, and it will generate a nice dashboard to show your energy usage.
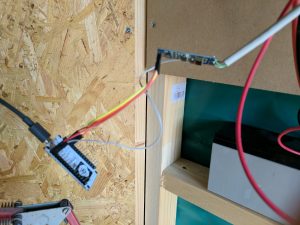
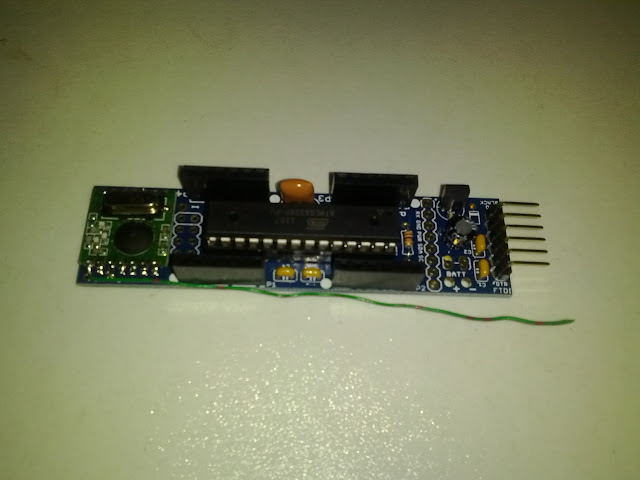
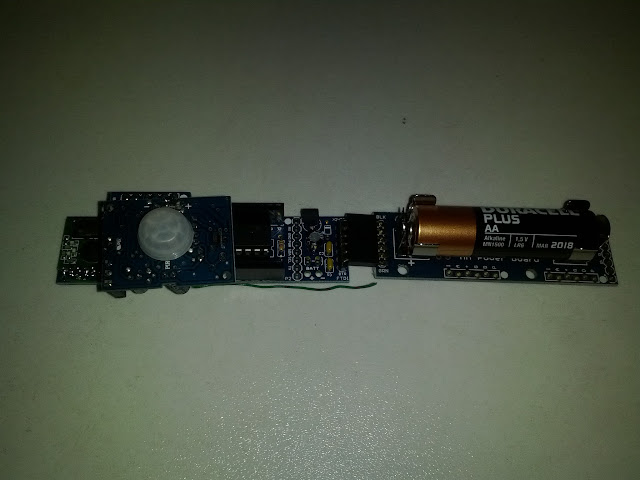
Water consumption is on there because it seems UK water meters broadcast their readings unencrypted on a band that can be read with a cheap USB dongle. I wrote some python to read the meter and push the stats into Home Assistant. I also wrote some software to run on a Pi connected to my two solar systems to read the meter information there and push it into Home Assistant.
I’m hoping once I’ve collected data for a full year, I can work out if I can get a decent ROI on a house battery.
Future Plans
One of the big things at the moment is LLMs (I won’t call them AI!) and Home Assistant can actually make use of them right now. This means I can replace all my spyware Google Homes with a fully local solution running on some low powered Raspberry Pi zeros, using a local LLM for more natural language communication. Plus you get the ability to add custom wake words, which will be fun.
I’ve also got a Pi with a 10 inch display on my desk that I want to turn into a control panel to put somewhere in the house, possibly in the entrance way.